A Master Thesis Submitted to the Faculty of American Military University by Richard Garling
The author hereby grants the American Public University System the right to display these contents for educational purposes.
The author assumes total responsibility for meeting the requirements set by United States copyright law for the inclusion of any materials that are not the author’s creation or in the public domain.
© Copyright 2020 by Richard Garling
All rights reserved.
Dedication
I dedicate this thesis to my wife. Without her love and devotion, without her belief in me and her ungodly amount of patience, support, and encouragement, I could not have completed this work. I do all of this for her.
ACKNOWLEDGMENTS
I wish to thank Dr. John Rhome and Dr. Novadean Watson-Stone for their support and the knowledge they imparted while I was a student of theirs. Their guidance was most appreciated, especially when I had doubts if I was going in the right direction. Dr. Stone was particularly helpful in getting me to wrap my head around what a literature review provided. Dr. John, for putting my head on straight when I would doubt myself. I am forever in your debt.
Table of Contents
Purpose of the Research Project: 14
The Significance of This Study: 15
Why Earned Value Project Management (EVPM)?. 25
Project Performance Metrics. 26
Must-Have Documents in EVPM… 31
The WBS (Work Breakdown Schedule) 31
PMI Process (Data-Intensive) 34
Artificial Neural Networks. 48
Practical AI Tools in Project management 65
AI-assisted Project management 65
Project Implementation Decisions. 66
LIST OF TABLES
TABLE
Table 1 Test Data MAPE Results. 49
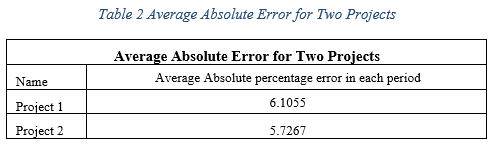
Table 2 Average Absolute Error for Two Projects. 51
Table 3 Overview of the EVM Attributes. 54
Table 4 Overview of the Best Parameter Settings of the AI Techniques. 56
Table 5 Overview of the MAPE for Different Values of t 57
Table 6 General Performance Across the Early, On-Time, and Late Scenario. 57
Table 7 Overview of the MAPE (%) and Mean Lags (%) of the EVM forecasting Method. 61
LIST OF FIGURES
FIGURE
Figure 1 Basic Time and Cost S-Curve in EAC.. 48
Figure 2 Forecasted results and Actual results for Project 1. 50
Figure 3 Forecasted results and Actual results for Project 2. 50
Abstract of the Thesis
Two hundred years ago, the industrial revolution changed the way the world produced goods, transported them, and communicated. Today, Artificial Intelligence (AI) is a new revolution that will be for more impactful than ever imagined. Any tasks that can be codified and programmed into a computer, even the jobs of so-called knowledge workers, such as Project Managers (PM), will be automated. However, has AI had a beneficial impact on Project Management in assisting projects to conclude successfully? This study examines the practical application of AI on Project Management, and whether that impact has been practical. Previous studies show that using AI in conjunction with Earned Value Management (EVM) methods, can add value, but practical applications still have a way to go to meet project needs.
Keywords: Artificial Intelligence, AI, Machine Learning, Project Management, Earned Value Management, EVM.
Introduction
Two hundred years ago, the industrial revolution began making drastic changes to the world. It was changing production, transportation, communication, and it was occurring everywhere. Many thought it would never impact their little corner of the world, yet it would. The poor cobbler who had produced shoes one pair at a time, found himself replaced by a machine that could spit out hundreds of shoes a day. The worst part, the human operating the machine did not have the knowledge the cobbler had of making shoes, and that machine operator did not need to understand how to make shoes.
Today, we see the beginnings of a new revolution in performing tasks. This new revolution could cause changes for more impactful than the Industrial Revolution ever imagined. Commonly referred to as the AI (Artificial Intelligence) revolution, it is also known as Machine Learning (ML), Cognitive Computing, Natural Language Processing (NLP).
AI is estimated to replace over 1.8 million jobs, but it will create 2.3 million more jobs; and it could create over $2.9 trillion in business value (Kashyap, 2019). AI will impact everything, including production, transportation, communication and decision making. Any tasks that can be codified and programmed into a computer, even the jobs of so-called knowledge workers, such as Project Managers (PM), will be automated. Furthermore, AI would complete these tasks much quicker, more efficiently, and economically.
An example of a knowledge worker trade that was once human-intensive, that required a tremendous amount of experience, and is now run almost exclusively on computers, is stock trading. Gone are the trading pits that used to employ over 5500 traders. Today, around 500 traders do most of their trading on networks using AI tools to make decisions. The Chicago Mercantile Exchange switched to trading commodities via a network in 2015; today, sophisticated algorithms match buyers and traders (Davenport & Kirby, 2016).
Questions arise as to whether a machine will ever replace humans. Many scoffed at the mere thought of robots replacing humans and at the idea that computers would be able to think like humans, make decisions like humans. Not likely since computers have one underlying problem, they are not human. Humans can create a device that can perform many mundane, repetitious routine tasks. Humans can develop machines that make decisions based on what is “learned.” However, AI tools lack one essential component; humans can perform multiple tasks; they can switch to a different task on a whim; machines cannot. Computers are good at delivering the same jobs over and over as per programming, nothing more; And computers are not self-aware.
AI devices are designed and built to receive information from their environment and are programmed to take actions that increase the likelihood of a successful conclusion. AI is capable of interpreting externally fed data correctly, of learning from such input and make decisions from that data based on algorithms programmed into the system. Sometimes this process is referred to as automation. However, automation is a controlled process. Automation follows the logic and the rules programmed into it; AI can reflect intelligence, even human intelligence (Lahmann, Keiser, & Stierli, 2018). Nevertheless, AI is still limited by what has been programmed into its system, nothing more.
Traditional Project Management is a temporary effort to create something unique, such as a product or a process (Institute, 2019). A project has a beginning and an end. Managing a project is a process. PMI describes five process groups and ten knowledge areas a project can go through from start to finish; on a high level, these processes encompass Initiation, Planning, Executing, Monitoring and Controlling, and Closing phases of a project. Project Management is a manually intensive and data-driven endeavor, all of which AI thrives. AI is nothing without data; lots of data (Lee, 2018). It could use existing tools, such as MS Project (“Microsoft Project Software,” n.d.) and many other project management software, each serving as repositories for the data generated by project activities. Many project management applications can store information concerning scheduling, costs, determining earned value, but the Project manager must tell the system to create these reports manually; some of these tools can analyze the data. Many of the project management software’s claim to have AI capabilities, that no human intervention is required, that it automates simple tasks, creates a greater understanding of the status of project performance (Russell & Norvig, 2016). Still, the reality is they are not full-blown AI-controlled project management tools. Some come close to project assistants, but human intervention is required. After all, someone must input the data used by machine learning, and a project manager is still going to need to decide a course of action.
Earned Value Management (EVM) integrates the project scope, schedule, and costs into a systematic process used in project forecasting (Fleming & Koppelman, 2010). EVM is the accurate measurement of a project’s work performed against its baseline plan. EVM provides the project manager with precise information concerning the current status of the project at a given point; is it behind schedule, ahead of schedule, on time, over or under budget. The project manager using EVM can tell at any given moment where the project should be in the number of tasks completed and how much money should have has been spent up to now. Determining the precise status using EVM is an intensely manual process. The project manager needs to determine project scope, secure resources, create the schedule, determine the costs, gain approval, set a baseline for the project, and measure actual performance all through the project. If the project should fall behind, the PM must determine the cause and the cure for getting the project back on track. The project manager could spend days putting the information together if the project is a significant endeavor. AI could prove to be useful in these circumstances by making the calculations in mere seconds.
Problem Statement
The problem this paper will address is in determining if AI and EVM used together can improve project success significantly. Due to the intensely manual characteristics of traditional waterfall project management and the nature of the data generated by projects, the ability to utilize AI effectively to forecast project success is questionable. The ability to combine AI with EVM to assist the success of projects would also be questionable. Questionable mostly because no two projects ever run the same, and because EVM adds additional work onto an already heavy workload. AI is very data-dependent, and that data must be clean data with no ambiguities in formatting. Machine Learning loves structured data, data that is categorized, labeled, searchable. Structured data is more straightforward to analyze than unstructured data. Unstructured data has no defined formatting; it is difficult to collect, process, and analyze. EVM also uses structured data, such as the project schedule, costs, plan. All of these require a structured input, such as the reporting of time worked against the project plan. The question one asks is what parts of AI will work well with project management. Expert systems, a system that emulates the decision-making capabilities of a human expert, could be a possible tool. Chat-Bots, also known as conversational agents, mimic written or spoken human speech. They are used to simulate a conversation with real people. Project success predictor tools can predict project success before the project starts (Boudreau, 2019).
Purpose of the Research Project:
The purpose of this study is to evaluate AI tools using EVM and if they improve the success rate of projects or the ability to forecast that success rate. It will also examine AI tools not being used with EVM to determine if applying them could improve the project success rate. Can AI, in conjunction with EVM, assist the Project Manager in making decisions during the project; if so, which tools work most effectively with earned value metrics. Using AI to integrate and evaluate the triple constraint of projects – the scope, schedule, and budget – all significant components in EVM formulas used for accurate measurement analysis of the status of the project at a given point of time in the project’s lifecycle. Instead of the Project Manager spending countless hours working the numbers, machine learning algorithms could analyze the data in seconds, providing the needed information and suggest a possible direction.
Hypothesis:
This study intends to prove or disprove the following hypotheses through the evaluation of existing literature and practical examples.
- 1. Artificial Intelligence or machine learning tools can, when integrated with Earned Value Management tools, assist Project Managers in increasing project completion success rates above 95%.
- 2. Alternatively, AI cannot be successfully integrated with EVM to increase project success rates above 95%.
The Significance if This Study
This study intends to advance the understanding of applying AI using EVM to project management. It will identify the various component phases of the project management plan and discuss possible solutions to how AI could apply. Much like the Industrial Revolution 200 years ago, the AI revolution is going to change the way humans do just about everything, even project management. This study will concentrate on how AI, and machine learning, using EVM, can assist project managers in making decisions throughout the project lifecycle. Will AI replace Project Managers? Not likely. Recall the advent of the Automatic Teller Machine (ATM) and how it would spell the end of bank tellers as a profession, and yet there are more tellers today than when ATMs were first introduced (Bessen, n.d.). This study will examine possible solutions to apply AI tools and which AI tools to use, which fit well with many, if not all, aspects of project management. This study will concentrate on applying AI using EVM to project management, so it increases the success rate significantly. It will primarily focus on integrating EVM metrics measurements into AI algorithms. This study will concentrate on determining if there is any improvement in the percentage rate of successful project completions that applied AI with EVM to project management. History, as far back as 2013, has shown that 50% of businesses experienced an IT project failure. By 2016 that number had increased to 55%. Much of the project failure was due to poor planning, with over 56% of projects failing to meet expectations (Florentine, 2017). 85% of businesses say that AI will significantly change the way they do business in the next five years (Project Management Institute, n.d.). Studies have shown that Project Managers can use up over 54% of their time on administrative project tasks, tasks that could be handled by AI (Kashyap, 2019).
EVM tools have been used successfully for over fifty years by the military in measuring the performance of projects. This study will focus on using EVM formulas resulting in the development of algorithms that monitor and analyze key metrics like Cost Performance Index (CPI) versus actual costs (AC) versus planned costs (PC). These algorithms would focus on real-time reporting aiding decision making concerning the direction of the project and recommending any actions needed. These real-time observations, produced by AI algorithms, would allow the Project Manager to manage the project, relieving them of the mundane, but the necessary chore of gathering and manipulating data. Furthermore, these algorithms could accurately predict the success of the project at a 15% to 20% completion point, as is done manually today (Fleming & Koppelman, 2010). Integrating EVM formulas with AI algorithms would help assist project managers in completing projects if applied correctly. This study will include literature reviews on existing materials available on the integration of AI and EVM in project management today. It will explore if EVM used in AI is useful, and if not, why not. Furthermore, if EVM in AI was effective, could it be as useful if applied elsewhere in project management. This study will consider the different AI algorithms available today and determine potential applications using EVM in project management.
Literature Review
Project Management
Kerzner (2017) defines a project as having a specific objective creating business value and should target completion within a specific timeframe to explicit requirements. A project must have a defined start and end dates, a defined budget, consume human and non-human resources (money, people, equipment). Project management is the application of knowledge, skills, tools needed to achieve the goals of the project. Information and communicating are keys to managing projects to a successful conclusion.
Project Management has been both a savior and a problem when it comes to project management. It has accomplished significant endeavors such as the Hoover Dam, but it has trouble with completing, successfully, 50% of the projects started in information technology. Today, information technology runs the world (Lee, 2018). However, recent history, as far back as 2013, has shown that 50% of businesses experienced an IT project failure. By 2016 that number had increased to 55%. Much of the project failure was due to poor planning, with over 56% of projects failing to meet expectations (Florentine, 2017). Today, 85% of businesses say that AI will significantly change the way they do business in the next five years (Project Management Institute, n.d.). Studies have shown that Project Managers (PM) use up over 54% of their time on administrative project tasks, tasks that could be handled by AI (Kashyap, 2019).
Robertson and Robertson (2013) note the importance of the risk register. The documentation for each risk should include a risk owner; every owner can own more than one risk. The risk owner’s responsibility is for tracking the status of the risk. The risk owner is responsible for assisting in developing a risk plan for each of their risks. They are responsible for notifying the team and management, and the threat has become an issue, and for launching the approved risk plan for the occurring risk.
A description of the risk should be concise, to the point. It should contain the risk description, the trigger event, the probability of the risk occurring. The explanation should describe the risk and the impact on the project should it happen. This explanation should contain the plan to mitigate the risk should it become an issue (Kendrick, 2009).
Knowing the work and the risks are the best defense for handling problems and delays. Kerzner (2017) defines risk as a measurement of the probability and consequence of not achieving the defined project goal. Assessing potential overall project risks brings to the forefront the need for changing project objectives. It is these risk analysis tools that allow the PM to transform an impossible project into a successful project (Campbell, 2012). Project risks become increasingly difficult when dealing with an unrealistic timeline or target date when given insufficient resources or insufficient funding. Shishodia, Dixit, and Verma (2018) found that schedule, resource, and scope risks are the most prominent risk categories in Engineering and Construction (E&C), Information Systems/Technology (IS/IT), and New Product Development (NPD) projects, respectively.
Similarly, exciting vital insights have been drawn from the detailed cross-sector analysis, depicting different risk categories based on novelty, technology, complexity, and pace (NTCP) project characteristics (Shishodia et al., 2018). Knowing the risks can help to set realistic expectations, levels of deliverables, and the work required given the resources and funding provided. Managing risks means communicating and being ready to take preventive action. Gido and Clements (2012) felt the PM could not be risk-averse; accepting risk will happen, and it is part of the job; doing nothing is not an option. Kendrick (2009) describes the need for the PM to set the tone of their projects by encouraging open and frank discussions on potential risks. According to Kendrick (2009), because technical projects are highly varied, they have unique aspects and objectives which many times differ from previous work, that no two technical projects are alike. The PM needs to encourage identifying risks, the potential impact on the project, and the likelihood of occurrence requires developing risk response plans and monitoring those risks (Kendrick, 2009).
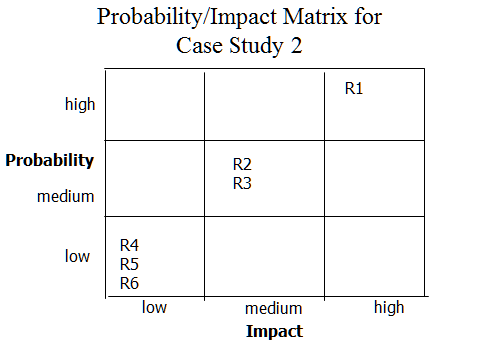
Gido (2012), Kerzner (2017), and Kendrick (2009) advocate performing qualitative and quantitative risk analysis and prioritize risks by ranking them in order of probability and impact. Ranking risks by their likely probabilities allow the PM to identify what the project team feels are the risks that will need in-depth analysis to determine potential impact costs on the project. Qualitative risk analysis defines the roles and responsibilities for determining risks, budgets, and schedule impacts to the project. The risk register and probability/impact matrix would contain all the information developed during the analysis.
PMI’s PMBOK (Institute, 2019) instructs that the PM can determine risk ranking by assessing the probability of the risk occurring. The benefit of this analysis allows the PM to concentrate on high priority risks, thus reducing the level of uncertainty. Probabilities are determined using expert judgment, interviews, or meeting with individuals chosen for their expertise in the area of concern to the project. These experts can be either internal or external to the project.
Kerzner (2017) listed several Quantitative Analysis methods commonly used to analyze risk. These included payoff matrices, decision analysis, expected value, and Monte Carlo process. Monte Carlo attempts to create a series of probability distributions, transforming these numbers into useful information that reflects any cost, technical issues, or schedule problems associated with the risk.
Shishodia et al. (2018) described impact analysis to investigate the effect risk will have on the project’s schedule, cost, quality, ability to meet project scope. The impact analyses will also look at the positive or negatives effects of a risk on the project. If the level of impact is significant enough, and its probability of occurring high enough, it will merit quantitative analyses to determine the effect it will have on the project.
Inputs to the qualitative risk analysis process include the project risk management plan. Here, the roles and responsibilities of managing risk are defined. Budgets, schedules, resources are defined as well. The scope baseline is considered an input; it includes the approved scope statement, the Work Breakdown Schedule (WBS), and the WBS Dictionary. These inputs can only change through an approved change control procedure (Mullaly, 2011).
To understand Earned Value Management (EVM), one must first understand what makes up a project. PMBOK (Institute, 2019) defines projects as having a start and a finish, not meant to be an ongoing endeavor. Of concern to the Project Manager (PM) are the parts between the beginning and the end. Furthermore, it is how these parts come together to perform the required tasks at the right time, bringing the project to a successful conclusion that is known as project integration in which EVM plays a valuable role (Fleming and Koppelman, 2010).
Integration management comprises the processes and activities that identify, describe, join, and synchronize the various processes and activities within the process groups (PMBOK, 2013). EVM is what helps to ensure it stays on course in a synchronized order within the parameters established by the scope of the project. EVM is a set of tools that allow the Project Manager to measure that performance to determine if the project is on course or if it is in trouble. It can be applied using a minimal number of tools such as the scope, the Work Breakdown Structure (WBS), the project schedule, and regular reporting, tools that any good PM should use when managing a project. However, EVM works best when using all the tools available to the PM.
Project Integration puts the team on the planning path bringing together expert judgment to review the charter and scope requirements. From this review, the team can begin creating the WBS from which the project plan/schedule/budget draws information. The WBS allows the team to tie together the different tasks to a specific deliverable, which relates to a specific requirement of the business. It also allows the team to ensure that all tasks are completed in order and on time. It is one of the main tools used in EVM to measure the progress of the project.
As Campbell points out in his book “Communications Skills for Project managers” (Campbell, 2012), getting team members to work together is also an essential part of integration management. Part of the challenge with many projects is that the teams involved come from a variety of departments. Getting them to work together has its issues; each department can have its own set of rules and requirements by which it completes the work tasked to it. Staying ahead of these obstacles requires a considerable amount of skill on the part of the PM. Integration plays a massive role in defining the skills a Project manager will need.
Project Managers are unique people. The expectation is that they bring their projects to a successful conclusion with hopefully just enough resources, money, and time. The expectation levels are high, and the pressure extreme. Regularly asked to take on a new endeavor, to use resources that have not worked together before, and make it all work to produce something new. As Kendrick (2012) and Kerzner (2017) points out, Project Managers are no one’s boss; yet expected to get people to do the work required for the project and held responsible if they fail. It would take a special kind of leader to ensure smooth execution.
Leadership is no longer limited to one or two executives at the top of an organization. There are many different levels of leadership in any company, especially in today’s global economy, where resources specialize in each area of business. Everyone in the company must be a leader if the organization is to survive and thrive (Tichy and Cohen, 1997). Without good strong leadership, nothing works. Projects and project teams can get totally out of control because there was not good leadership running the group.
All through a project, the PM must establish and reinforce the vision and strategy by continuously communicating the message. Communicating helps to build trust, build a team, influence, mentor, and monitor the project and team performance. After all, it is people, Kendrick (2012) notes, not plans that complete projects. It is the plan that keeps the people going in a single direction towards a goal. The Project Manager, inspiring others to find their voice, keep the goals and objectives front and center. A successful project is a result of everyone agreeing on what needs doing and then doing the work. From initiation to closing, the project depends on the willingness of all involved to accept, to synchronize action, to solve problems, and to react to changes. Communication amongst everyone is all that is required (Verzuh, 2012).
However, amongst all the traits a leader needs, this one must be earned, and it is the one most admired, personal integrity. It is the foundation of leadership. It brings with it trust as we want to believe in our leaders, encompass faith and confidence in them, that they believe in the direction we are all going (Kerzner, 2014).
There are five success factors every project must meet to be successful. First is an agreement amongst the team as to the goals of the project. Second, a plan with a clear path to completion with clearly defined responsibilities used to determine progress in the project; third, continuous effective communications understood by all involved; fourth, controlling scope; and fifth, management support (Verzuh, 2012).
Determining success and measuring progress is where Earned Value Management (EVM) comes into the picture. EVM allows the PM to keep track of the progress of the project to the point of getting early warning signals of trouble ahead.
Earned Value Management (EVM)
Earned Value Project Management (EVPM), lamented by many a PM as being too much work with limited value. Resources push back at the PM, saying that there is too much documentation for little return. They have trouble seeing the value that EVPM brings to the table. Fleming and Koppelman (2010) describe EVPM as the project management technique for objectively measuring project performance and progress. They point out that EVPM is a disciplined approach to ensuring that the project stays on course and on time. Kerzner (2015) describes EVPM as a systematic process that uses earned value as the primary tool for integrating cost, schedule, technical performance management, and risk management. EVPM can determine the actual status of a project at any given point in the project, but only when following organizational rules, requiring a disciplined approach.
EVPM got its start back in the late 1800s when industrial engineers on the factory floors in the U.S. wanted to measure their production performance. These engineers created a three-dimensional way to measure the performance of work done on the factory floor. They created a baseline called planned standards, and then they measured earned standards at a given point against the actual expenses to measure the performance of the factory. Today, their formula is the most basic form of earned value management today (Fleming & Koppelman, 2010).
Approximately sixty years later, the U.S. Navy introduced the PERT (Program Evaluation Review Technique) to the industry as a scheduling and risk management tool. The idea was to promote the use of logic flow diagrams in project planning and to measure the statistical success of using these flow diagrams. It did not last very long because it was cumbersome to apply (Fleming & Koppelman, 2010).
However, PERT, when combined with the Critical Path Method (CPM) in 1957, could manage project scheduling and reporting. PERT/CPM is a method used to analyze the amount of time required to complete project tasks. PERT/CPM is used more when time is a significant consideration, not cost, in completing a project. It is considered an event-oriented method rather than a start and completion method, part of the reason why PERT works well with the CPM. The problem at the time was that computers had not become sophisticated enough to be able to support the concept (Archibald and Villoria, 1966).
Archibald and Villoria (1966) showed that a Pert/Cost concept could measure earned value. The implementation of Pert/Cost in industry required eleven reporting formats, one of which was Cost of Work Report, and within it, there was a format called value of work performed. Pert/Cost standard lasted about three years, mostly due to its cumbersome use, and industry not particularly liking uninvited intervention.
Fleming and Koppelman (2010) would go on to describe how, in 1965, the U.S. Air Force created a set of standards allowing it to oversee industry performance without it telling industry what to do. What the Air Force did was to develop a series of broad-based criteria and asked that industry satisfy these broad-based criteria using their existing management systems. These criteria developed into the C/SCSC (Cost/Schedule Control Systems Criteria) that every company wishing to do business with the government was required to meet (Fleming & Koppelman, 2010).
Moreover, the results of these new criteria were impressive. However, problems also arose. The original 35 criteria grew, at one point reaching 174, some being very rigid and dogmatic, mostly inflexible, taking away from the original intent of being unobtrusive. In 1995 the National Defense Industrial Association rewrote the Department of Defense (DoD) formal earned value criteria and called the new list of 32 criteria the Earned Value Management System (EVMS) (Fleming & Koppelman, 2010). Eventually, these new criteria would become part of the American National Standard Institute/Electronic Industries Alliance guidelines, which we usually call ANSI guidelines. Furthermore, from this came a broad acceptance of the new criteria by industry.
Why Earned Value Project Management (EVPM)?
There are many reasons why every project should use EVPM. As Fleming and Koppelman (2010) describe, EVPM provides a single management system that all projects should employ. The relationship of the work scheduled to work completed provides an actual gauge of whether one is meeting the goals of the project. The most critical association is of work completed to how much money spent to accomplish the work provides an accurate picture of the actual performance cost.
Fleming and Koppelman (2010) understood that EVPM requires the integration of the triple constraint: Scope, Cost, Time, allowing for the accurate measurement of integrated performance throughout the life of the project. Integration is a big issue in managing a project. Many times, the project management team defines the project one way, the development teams another way, and further, still QA will look at another way. Everyone is reading the same sheet of music, but they are singing a different song. The requirement of the Work Breakdown Structure (WBS) has helped to bring alignment amongst the various teams impacted by the project. Its hierarchical structure helps to define the scope of the project in easily understood terminology to both the project team and the business sponsors (Fleming & Koppelman, 2010).
Study after study conducted by the Department of Defense (DoD) shows that those projects using EVPM have demonstrated a pattern of consistent and predictable performance history (Fleming & Koppelman, 2010). The studies have shown that results of project performance using EVPM early performance indicators as early as at the 10% -20% project completion point. The ability to show at that early stage the direction the project is going allows the Project Manager to adjust course making corrections long before it is too late.
Project Performance Metrics in EVM
The critical requirements for using metrics are that the project is baselined at the appropriate time and finding the real reason for any baseline change. Two critical documents in the project are the project plan schedule and the WBS (Kerzner, 2014).
Included with the WBS is a document that further defines each work package activity of the WBS known as a WBS Dictionary. Kerzner (2014) described the WBS Dictionary as a detailed description of the work to be done, setting activity precedents, and successors. It also lists dependencies within and outside of the project, such as corporate servers that may be needed to house the result of the work package. It also lists the resource(s) responsible for developing the work package and the duration level of effort, usually in hourly units, to accomplish the work. The WBS Dictionary would include the hourly rate for the resource (Fleming & Koppelman, 2010) (Kerzner, 2015).
Fleming & Koppelman (2010) would use the WBS and the project schedule to begin assembling the following metrics used in the EVM process extensively:
Planned Value (PV)
Fleming and Koppelman (2010), Subramanian and Ramachandran (2010) describe the importance of gathering all the information for preparing the schedule for the project. A PM can now measure the value of the work that should be done at any given point in the project because they have a defined task with a defined unit of measure to be done by a prescribed time. This information is known as the Planned Value (PV) of the project.
The Planned Value (PV): The PV (aka Budgeted Cost of Work Scheduled (BCWS)) (Institute, 2019) is the approved budgeted cost for each work package. Sometimes referred to as the performance measurement baseline (PMB), and the total PV of the project is known as Budget-at-Completion (BAC). BAC includes planned duration and cost for the activity (Fleming and Koppelman, 2010) (Subramanian & Ramachandran, 2010).
Earned Value (EV)
Subramanian and Ramachandran (2010) then explain the Earned Value (EV) (aka: Budgeted Cost of Work Performed (BCWP)), is the value of the approved budgeted amount at a given point in the project (Fleming and Koppelman, 2010) (Subramanian & Ramachandran, 2010). For example, if PV = $912 per day of work planned, by day three, the expected EV would equal $2736.00 worth of work completed according to the plan. If PV = $10,000 per day work performed and the project duration are 60 days, BAC would equal $600,000.00. PV by day fifteen should equal $150,000.00.
From this base, the PM now has the Planned Value (PV); you can measure Earned Value (EV) from the status reports, which indicate the actual work done. Using the information from the status report, the PM can determine the cost of the actual project (AC). Determine the Cost Variance (CV) by subtracting your AC from the EV: CV = EV – AC.
Cost Performance Index (CPI) can be determined by taking the EV and dividing it by the AC: CPI = EV/AC. CPI is used to determine if the project is on track with its costs. A CPI of greater than 1.0 means the project is under budget, while a CPI of less than 1.0 means the project is over budget. Over budget implies that the project is spending more and getting less, while under budget could mean the project is getting a bigger bang of production for their buck.
EVM will alert the Project Manager to any problems with the budget and schedule at any chosen point. So long as the scope, WBS, schedule, accurate regular reporting, and completing EVM measurements will provide performance measurements the PM can use (Fleming and Koppelman, 2010) (Subramanian & Ramachandran, 2010).
Actual Cost (AC)
Fleming and Koppelman (2010) show the Actual Cost (AC), (aka: Actual Cost of Work Performed (ACWP)), as the number of hours multiplied by the rate per hour. As each resource finishes the day’s work as planned, they record their time, in MS Project, for example. If the PM takes the work activity or work package defined to take two resources five days to accomplish, and each resource costs $57.00 per hour, and a workday is eight hours per day, then the PV should come to a total of $4560.00 (80 hours x $57.00). By day three, the Project Manager would have the expectation that the PV of work completed would equal $2736.00. However, AC came in at $3648.00, and only two days of planned work accomplished. According to the results, the project is overspending and behind schedule. The expected cost was supposed to have been a total of $2736.00 for 48 hours of work.
Using the Cost Variance (CV) formula, the PM can determine where the project stands at this point: CV = EV – AC. Cost Variance (CV) is a way to determine cost performance on a project. It is equal to the Earned Value (EV) minus the Actual Costs (AC). This measurement is critical as it indicates the relationship of physical performance to actual costs (Fleming and Koppelman, 2010) (Subramanian & Ramachandran, 2010). From the above example the formula would look like: CV = $2736.00 – $3648.00 = -$912.00.
Another way to look at the same relationship is through the Cost Performance Index (CPI). It is considered the more critical of the Earned Value Metrics (Fleming & Koppelman, 2010). A value of less than 1.0 would mean the project is spending more than it is getting, while a value greater than one means the project is spending less and getting more. From the above examples the formula would look like this:
CPI = EV/AC
CPI = $2736.00/$3648.00 = .75
As one can see, project CPI is less than 1.0. The project is spending more than it is getting done. The project is getting $.75 worth of work for every $1.00 spent.
The financial report shows what is needed to complete the project as far as cost is concerned. The PM uses the Estimate-to-Complete (ETC) and the Estimate-at-Completion (EAC) to indicate what is needed to complete the project. Use the following formula to determine ETC:
ETC = BAC – EV
ETC = $4560.00 – $2736.00 = $1824.00
Per Fleming and Koppelman (2010), use the above formula if expected project completion to be on time and budget. If as expected the project is neither on time nor within budget and this track is expected to continue, then they would use the following formula to determine ETC:
ETC = (BAC – EV)/CPI
Or
ETC = ($4560.00 – $2736.00)/.75 = $2432.00
Estimate-to-Complete is the number of funds needed to complete the project (Fleming and Koppelman, 2010) (Subramanian & Ramachandran, 2010). The method used to calculate the amount depends on the circumstances. From the above example, the variance experienced would continue for the remainder of the project.
Both Fleming and Koppelman (2010) and Subramanian & Ramachandran (2010) would use the same logic for determining the Estimated-at-Completion costs in that the variances experienced will continue. The formula to be used is as follows:
EAC = AC + [(BAC − EV) ÷ CPI]
Thus
EAC = $3648.00 + [($4560.00 – $2736.00))/.75)] = $6080.00
The EAC is equal to $6080.00, and the Variance-at-Completion (VAC) would be equal to:
VAC = BAC – EAC
Thus
VAC = $4560.00 – $6080.00 = -$1520.00
Must Have Documents in EVPM
As described by Kerzner (Kerzner, 2018), Kendrick (Kendrick, 2012) and the Project Management Institute (Institute, 2019), there are four documents that every project must have, as a minimum, in order to employ EVPM:
The Scope
The most important document that can assure success in a project is the project scope document. EVPM cannot be effectively employed unless the Project Manager has accurately captured the project scope; in Agile, the Scrum Master must define done. It is impossible to measure done with an ill-defined done definition. The reason for EVPM is to be able to measure the work of the project as it progresses.
The scope, as defined by PMI, is the process of developing a detailed description of the project and product. The key benefit of this process is that it describes the product, service, or result boundaries by defining which of the requirements collected will be included in and excluded from the project scope (Institute, 2019).
The WBS (Work Breakdown Schedule)
The WBS, as defined in PMI PMBOK (Institute, 2019), is a decomposition of the work deliverables into manageable work packages; it organizes and defines the total scope of the project. The WBS shows, in hierarchical form, each task required to complete the project. Several Tasks can become work packages of various durations, usually one day to one week. These packages are then aligned by precedent to determine a project schedule. The WBS will also include the resources needed to do the work on a package.
Project Schedule
The project schedule deals with the placement of the defined scope and the tasks needed to accomplish the goals of the scope into a fixed timeframe allowing measuring progress throughout the life of the project. Kerzner (2018) and Kendrick (2012) suggest that these two rules are not unique to earned value project management and that they are fundamental to all proper project management. They go on to advocate that the project schedule is likely the best tool available for managing the day to day communications on any project. Moreover, Campbell (2012) and Gido and Clements (2017) agree that one of the best ways to control a project plan is to monitor performance regularly with the use of a formal scheduling routine. The recommendation from the two is to schedule the authorized work in a manner that describes the sequence of work and identifies the significant task interdependencies required to meet the requirements of the program. Include identifying physical products, milestones, technical performance goals, or other indicators used to measure progress. Also identify, at least monthly, the significant differences between both planned and actual schedule performance and planned and actual cost performance and provide the reasons for the variances in detail needed by program management.
The Budget
Ultimately, the project must have a budget. Fleming and Koppelman (2010) note that without knowing the costs of the different tasks that make up the project, the Project Manager has nothing to use in which to measure. These steps are particularly critical to an EVMP. Once establishing the baseline, the actual performance against the baseline will need to be measured regularly for the duration of the project. Periodically the Project Manager will want to measure how well the project is performing against the baseline. Project performance will be precisely measured employing EVM, generally expressed as a cost or schedule performance variance from the baseline. Such variances will give an early warning of impending problems and are used to determine whether corrective action is required for the project to stay within the defined parameters (Institute, 2019) (Kendrick, 2012) (Kerzner, 2018).
Baseline
Baselining, according to Kerzner (2018), is the process of Establishing a Performance Measurement Baseline (PMB), a baseline against which measuring performance is an essential requirement of EVPM. The PMB is the reference point against which a project will measure its actual accomplished work, telling whether the project team is keeping up with the planned schedule, and the amount of work accomplished relative to the monies spent.
Collaborative Software
Technology advancements have led to the growth in collaborative software such as Facebook, Twitter, and Instagram. Davenport and Kirby (2018) point out that advancements in collaborative communications platforms such as company intranets, instant messaging, and email, are now commonly found in almost all companies. Microsoft Project (“Microsoft Project Software,” n.d.) and many other project management tools include dashboard reporting systems. Bayern (2019) observed that Project Management methodologies have been moving away from a centralized control school of thought to a socialized control school of thought. Kerzner (2018) pointed out that these changes in management methods are mostly due to the globalization of business. Lee (2018) noted that more resources are located internationally in other nations, including India, China, Singapore, Mexico, Costa Rica, and others. This global community will require more elaborate communications and reporting tools in order to manage global resources ensuring projects are on-time and on-budget. New tools are required to ensure factually based decisions, evidence, not guesses, or opinion. Lee (2018) points out that managing these resources is one that AI can play a significant role.
PMI Process (Data-Intensive)
Project Management has developed a process that incorporates all the tasks needed in which to reach a goal from initiation to conclusion. Two of the most common methodologies are The Project Management Institute’s Project Management Book of Knowledge (PMBOK) (Institute, 2019), and Jim Highsmith (2010) developed the Agile methodology of project management, an iterative approach to software project management (Highsmith, 2010). However, the project completion success rate remains low; the need for determining the ability of a project to be completed successfully has increased.
Kendrick (2012) and Kerzner (2018) point out that the amount of data gathered in a project can be pervasive. Projects can be very data-intensive. Furthermore, that data can come in many forms, according to Boudreau (2019). From the start of a project, the documentation includes developing the project management plan, including the scope, schedule, cost, configuration, and change management plans. Moreover, Kerzner (2018) and Kendrick (2012) note, you can add the requirements management plan, the scope baseline, create the work breakdown structure (WBS), the schedule baseline (schedule), and the cost performance baseline (budget) to the list of documentation. Next are the quality management plan and process improvement plan and the human resources plan. Add the communications plan, the risk management plan, and finally, the procurement plan, giving all fifteen of the project planning components (Institute, 2019). Dam, Tran, Grundy, Ghose, and Kamei (2019) and Highsmith (2010) describes attempts to decrease the amount of paperwork required by developing the Agile Project Methodology. Dam et al. (2019) and Highsmith (2010) advocated only doing the documentation necessary and no more.
There are multiple formats in which to store the information gathered for all the above-described processes in project management. The WBS, for example, could be done within MS Project (“Microsoft Project Software,” n.d.); it could also be done in MS Excel (“Microsoft 365 Business,” n.d.) or on a paper napkin, as can the schedule or the budget of the project. The scope of the project is often an MS Word (“Microsoft 365 Business,” n.d.) document. Minutes for meetings can be tape-recorded or written in a text file. While tasks are part of the WBS, resources are informed of upcoming tasks by the PM via email or even verbally. Resources provide weekly status reports on completed tasks verbally in a meeting, or a written report delivered to the PM by email or through an integrated project software system. MS Project Server (“Microsoft Project Software,” n.d.) provides how to report time per task automatically. Keeping project information documented in a useful manner can be a time-intensive endeavor (Kerzner, 2018) (Kendrick, 2012) (Gido and Clements, 2012) (Boudreau, 2019).
Boudreau (2019) shows that Artificial Intelligence (AI) is entering the world of project management. Project Managers are known to be quick on their feet, having to make decisions at a moment’s notice, sometimes based more on intuition than on facts. The need for intuitiveness is due to the length of time, as explained above, it would take to gather the information needed in which to base a decision on facts. While these facts are available, it takes time and effort to gather it in a form useful to the PM. He argues that AI can be an essential assistant to the PM in accomplishing the goals of the project.
Unfortunately, much of this data is lost because it is not easily accessible due to the myriad of mediums used as storage, no two being the same. AI depends on data, lots of data. Moreover, this data must be clean (Hosley, 1987). Some of the first tasks required in using AI systems are standardizing and cleaning up past data if it even exists. There is little to no standardization maintained between project managers, let alone organization. Furthermore, AI thrives on continuity in data. Boudreau (2019) reminds us that project management, by its very makeup, is more a moving target, thus making it challenging to apply AI.
Intelligent Agents
Boudreau (2019) showed that many AI tools used to help manage projects, including project success predictor tools, stakeholder management, virtual assistants, change control, risk management, and Natural Language Processing (NLP) help with analyzing resource needs and assignments. While there are tools that help with the WBS and scheduling verification, Jordan (2018) points out that these are not known to have the ability to learn from the data, so are not exact AI tools.
AI can help integrate the administration of projects without needing any input, according to Lahmann, Keiser, and Stierli (2018) and Ko, C., & Cheng, M. (2007). AI devices help perceive the environment taking action to increase the likelihood of a successful outcome. In project management, AI would be able to manage multiple projects with few resources. It does not require much input, with many of the tasks done automatically. AI can help with making decisions automatically. It can help with identifying the right personnel for a task identifying the skills and experience needed to accomplish the defined task. AI can aid Project Managers in helping them make informed decisions (Munir, 2019).
Boudreau (2019) suggests that project predictor tools can help to determine if a project has a high chance of success before it starts. Savings in resources and energy could be enormous by analyzing projects for success before execution. However, the tool must have a high rate of reliability (Boudreau, 2019), something needing further analysis and research. Wauters and Vanhoucke (2015) have shown some of these AI tools algorithms to be highly accurate in their predictions, primarily when used against EVM/ES methods where the datasets are similar. The issue they confronted occurs when increasing the discrepancies in datasets show AI prediction limitations.
Stakeholder management involves using NLP and sentiment analysis, assisting PM’s in communication and managing people. The focus is on assisting in managing project resources and stakeholders. One issue pointed out is that AI may be able to offer commonly known suggestions for handling an upset resource; it would take human intervention to resolve the issues of concern to the upset resource (Boudreau, 2019). Some of these AI tools using NLP can distinguish the assembly of personalities by analyzing the numerous documents and messages created during a project’s lifetime. NLP can decipher utterances using language subset and nuances special to project management. Tests have shown abilities to reveal information based on these utterances in emails, status reports, meeting recordings showing that a resource or a stakeholder believes the project to be on course or in jeopardy of falling behind (Munir, 2019).
When a request made to consider a change in the scope of a project, analyzing the impact on the scope, the schedule, and the budget can be an enormous task. The PM must determine if the change fits into the existing scope or changes it altogether. Will the requested change impact the project schedule; if so, how much? Will extra resources be required? What will the cost be? Will the requested change impact other projects currently in the queue? AI tools used to manage change requests could collect all the necessary data, perform the analysis, and produce a more accurate assessment of the overall impact to the project and the company program (Kerzner, 2018)
Auth, Jokisch, and Dürk (2019) described Automated Project Management (APM) as all PM tasks and activities able to be automated. Automated Project Management Systems (APMS) focuses on software applications that support scheduling, budgeting, resources. APMS systems are not expert systems noting that the use of AI was not the original intention of APMS. APM is now tied closer to AI to include data-driven project management, predictive project analytics, and project management bots (Davenport, 2018) (Jordan, 2018).
AI concentrates on the development of intelligent agents, according to Russel and Norvig (2016). Intelligent agents can perceive their environment and take actions derived from that environment. These systems can act autonomously, persist for more extended periods, adapt to changes, and track objectives (Russell & Norvig, 2016). These agents can strive for the best results or the most valued results under uncertainty (Auth et al., 2019). AI is utilizing mathematical and scientific models and methods including statistics/stochastics, computer science, psychology, cognition, and neuroscience (Auth et al., 2019)
Project duration has concerned many in project management. Wauters and Vanhoucke (2016) conducted several studies that concentrate on predicting the final duration length with any degree of accuracy. Fleming and Koppelman (2012) have noted that manually managing a project lengthens the entire duration, especially with EVM due to the number of calculations involved. Determining the current state of the project involves using Earned Value Analysis (EVA). Subramanian and Ramachandran (2010) described the four aspects of EVA analysis as Cost variance (CV), Schedule Variance (SV), Cost Performance Index (CPI), and Schedule Performance Index (SPI). A CV allows the Project Manager to determine if the project is running over-budget; SV shows schedule status; CPI measures the efficiency of the amount spent and the value recovered, and SPI indicates the rate of progress for the project. EVA provides a method assessing the performance of the project by examining the scope of the project, its schedule, with cost on performance. Project management and the game Go have similarities in common; they demand creativity, intuition, and strategic thinking. AI was able to defeat the world leader in the Go game, a human. One need only imagine the possibilities for AI in managing projects.
Artificial Intelligence
Lee (2019) describes AI as being dedicated to solving problems and finding answers using machines and logic on tasks that generally required humans to perform in the past. He notes that AI has proven to be very good at pattern recognition, identifying facial patterns, buying habits of consumers, analyzing large amounts of data to pull out hidden patterns. Zujus (2018) notes that most AI applications will follow what is known as narrow AI, designed to perform one cognitive task and perform that one task well, not designed to do any real thinking. It can learn based on the parameters defined, the data fed it, and not beyond them (Zujus, 2018).
The need to define an appropriate solution that fits the problem is of the essence in building AI solutions that work. Project management is, unfortunately, not a natural problem-solution fit for AI, according to Munir (2019). Solutions that help guide organizations have been developed by creating methods helping to create use cases. These use cases help companies consider technology factors, the organization’s data, and the application domain and environment. They will need to identify domain issues and possible AI solutions. Hofmann, Johnk, Protschky, and Urbach (2020) developed a five-step method for developing use cases that have helped to connect AI solutions to organizational issues. Following design science research paradigms with situational method engineering, their five-step use case developing tool addressed the unintuitive nature of projects. It helped provide AI solutions that fit a company’s needs.
Wauters and Vanhoucke (2015), Wauters and Vanhoucke (2016), and Wauters and Vanhoucke (2017) conducted several research projects predicting project duration using AI. They dealt with questions concerned with AI’s ability to predict the final duration with a degree of accuracy (Wauters & Vanhoucke, 2016). One method of the studies showed that using Monte Cristo simulations with principal component analysis and cross-validation, they could predict project duration with a high degree of accuracy. Principal Component Analysis is a statistical procedure that analyzes components using an orthogonal transformation by converting sets of possibly correlated variable observations into uncorrelated linear variables called principal components. Cross-validation is used in machine learning models as a resampling procedure when data is limited. (Wauters & Vanhoucke, 2016) were able to show that by using large topologically diverse datasets benchmarked against Earned Value Management/Earned Schedule (EVM/ES) methods that the AI methods outperformed the EVM/ES methods so long as the datasets were similar. The AI methods were able to predict with high accuracy the duration outcome of the project, even in the early and mid-state stages of the project. By gradually increasing the discrepancies between the datasets, they were able to show the limitations of the AI methods.
Wauters and Vanhoucke (2014) explored using Support Vector Machine (SVM) regression and AI against EVM/ES methods. Support Vector Machines are methods that stem from Artificial Intelligence and attempt to learn the relation between data inputs and one or multiple output values. However, the application of these methods requires more exploration in a project control context. Wauters and Vanhoucke (2014), in their research, used a forecasting analysis that compares the proposed Support Vector Regression model with the best performing Earned Value and Earned Schedule methods described by Lipke (2009). They then tuned the parameters of the SVM using a cross-validation and grid search procedure, after which they conducted a sizeable computational experiment. Their results showed that the SVM regression outperforms the currently available forecasting methods. Additionally, a robustness experiment setup investigated the performance of the proposed method when the discrepancy between training and test set becomes larger.
Bhavsar, Shah, and Gopalan (2019) analyzed using automation of Business Process Re-Engineering (BPR) with Software Engineering Management (SEM) and Software Project Management (SPM). They determined that AI will be the best approach and scope of automation SEM processes for software development organizations as Software Project Management (SPM) is a scientific art for planning, controlling execution, and monitoring. SPM approaches focus more on the essential requirements for the success of software project development (Bhavsar et al., 2019). BPR (Business process reengineering) projects are undertaken by organizations which are outward searching for necessary amendment within the organization performance and expecting radical changes in variables. Fundamentally, such organizations are unit trendsetters in their relative domains and market segments. BPR projects are generally large and take a long time along with significant inflow capital. BPR focuses on redesigning organizational workflows and business processes. BPR helps organizations to restructure their processes by aiming at the bottom-up design of their business processes. According to Joshi and Dangwal (2012), BPR is one in all the foremost ubiquitous development strategies used across the world.
Bhavsar et al. (2019) concluded that using BPR with change management is essential in software engineering management. They indicated that human managerial parameters would proficiently influence the execution and implementation of BPR and acceptance of software system improvement methodologies. Their evaluation indicated that a significant rise of AI had enabled a way to potential transformation for the BPR for software development organizations. AI, they theorized, will be the potential game-changer for the software project management and development life cycle processes. AI can help project managers to focus on establishing organizational goals by cost optimization and improving the quality of the product. Bhavsar et al. (2019) felt that human intuition, feelings, ideas, emotions, and passion could not be considered or replaced by AI. AI cannot be an alternative to a project manager but could be a helpful assistant to project managers in augmenting the effort of the software project development and management team and in improving the significant level of the success of the project by eliminating repetitive operations from the project.
Bhavsar et al. (2019) recognized that at this stage, a conceptual prototyping model requires a robust protocol design that enables integration of SEM with AI. They recognized that software industries had been widely adopting Agile methodologies in their software project and application development processes. However, some limitations need integration with other Agile-based frameworks or transitional waterfall methods, which can bring an Agile business process reengineering in the structure of the software development organization. They concluded that BPR has been enabling organizational capabilities towards the implementation of new initiatives with fewer complexities. It just requires a Process Life Cycle Method (PLCF) suitable for the organizational structure. Dam et al. (2019) pointed out that the rise of Artificial intelligence (AI) has the potential to transform the practice of project management significantly. Project management, they indicated, has a sizeable socio-technical element with many uncertainties arising from variability in human aspects; customer’s needs, developer’s performance, and team dynamics, for example. AI can assist project managers and team members by automating repetitive, high-volume tasks to enable project analytics for estimation and risk prediction, providing actionable recommendations, and even making decisions. AI is potentially a game-changer for project management in helping to accelerate productivity and increase project success rates. Dam et al. proposed a framework where leveraging AI technologies offer support for managing Agile projects, which have become increasingly popular in the industry (Dam et al., 2019). Agile, they felt, would be a good fit for automation in AI because of the structured methodology used in managing projects. They noted that Agile centers around a product backlog; backlogs are a list of items, customer requirements, and requests. User’s stories describe what the customer wants to do in software. Execution in Agile development divides into sprints involving sprint planning. Each sprint uses a burndown, or burnup chart for tracking progress, making all the documentation above ripe for AI automation.
Machine Learning
Machine learning (ML) is a subset of AI that uses statistical techniques to give computers the ability to learn from data without being explicitly programmed. Audrius Zujus (2018) points out that AI and ML are acronyms that have been used interchangeably by many companies in recent years due to the success of some ML methods in the field of AI. ML denotes a program’s ability to learn, while AI encompasses learning along with other functions.
Theobald (2018), discussed how machine learning is heavily dependent on code input. He observed how machines could perform a set task using input data rather than relying on a direct input command. Boudreau (2019) observed that ultimately, ML uses data for two things: prediction or classification. Theobald (2018) notes the commonly used algorithms in ML are a calculus-based mathematical formula designed to find the least error between correlations in the data. One conventional algorithm is minimizing the cost function, and it measures the performance of an ML model for given data. It quantifies the error between predicted and expected values presenting it in the form of a real number. Boudreau (2019) observed that ML is good at running multiple scenarios and selecting the best one or the one with the highest probability of success; it is good at making a prediction. Whereas, Monte Carlo simulation models the probability of different outcomes, saying here are the likeliest outcomes. The advantage, according to Boudreau (2019), is that Monte Carlo gives a range of possibilities. The disadvantage is that it is not good at making a prediction; whereas, ML is. Monte Carlo is saying, here are the best options that fit the question asked. Boudreau (2019) and Theobald (2018) point out that ML needs a large amount of data in which to make a valid prediction. Search engines commonly use ML due to their predictive abilities. ML works well with supervised, unsupervised, and reinforcement learning datasets. ML is also well suited for use in Agile projects due to the number of iterations that allow the opportunity for continuous improvement (Boudreau, 2019).
Project Management is at a point where it needs to find a way, a process, a method that will assist the methodology in completing more projects successfully. As noted earlier by Florentine (2017), over 50% of projects attempted, fail. Undoubtedly a number way too high. Furthermore, 85% of businesses say that AI will significantly change the way they do business in the next five years (Project Management Institute, n.d.). Studies have shown that Project Managers can use up over 54% of their time on administrative project tasks, tasks that could be handled by AI (Kashyap, 2019). These tasks include developing the scope of the project, creating requirements, developing the WBS, project scheduling, budgeting, using EVM extensively to determine if the project is progressing as expected. Applying AI tools may be the answer. Examining the AI tools being used today in many different technologies on many different business processes and practices could be used to either assist the project manager or run the project with limited human input. This research aims to determine usage and what may be possible.
Methodology
This paper will utilize past and current research in the existing literature first to analyze the history of AI usage in project management and the effectiveness of these efforts. Then, the study shall examine the history of using EVM formulas in project management and the effectiveness of these efforts. The main objective is to show the usage of each of these tools in project management. By first proving the effectiveness of these tools, the ability to rationalize integrating them to create practical tools that can assist project managers becomes apparent. Examining past studies can reveal what questions were asked and answered. Examining previous studies may show the effectiveness in increasing project success when applying AI, or even when applying EVM. Past studies can show if integrating AI and EVM successfully increased the completion rate of projects.
Step one of this paper will be an extensive analysis of the existing literature to determine the use of AI in project management. While EVM has been utilized very effectively for over 50 years in project management, AI is a relatively new phenomenon.
In that analysis, this paper will examine the various AI algorithms available, its usage in assisting project managers in managing a project, and measuring their overall effectiveness. This paper pays attention to project data organization, and the dependency algorithms have on this data to work effectively. Data is crucial to AI usage as AI requires lots of data. Furthermore, it must be clean, well-organized structured data. This paper will examine the usage of both structured and unstructured AI data used in the algorithms used in project management. Structured data is data organized into fixed fields within the rows and columns usually in a table; it is data that is searchable because it categorized and labeled (Boudreau, 2019). Structured data is easily searchable by AI algorithms.
Nevertheless, a contention in project management is that much of the data produced by projects is unstructured data, data that does not have a pre-defined model. Examples of unstructured data include Natural Language Processing (NLP), aka audio data. Images and text files are unstructured data; examples include weekly status reports, PowerPoint presentations. Projects have a great mix of both structured and unstructured data. However, there are algorithms available that can analyze both structured and unstructured data efficiently. AI usage of unstructured data can be essential in decision making in a project.
Step two of the research will examine using EVM in project management. EVM has a long history of over 50 years of usage in managing projects. The earned value represents the actual value of work accomplished at a given point in time. Earned Value (EV) represents the budgeted cost of work performed (BCWP), and when compared to Budgeted Cost of Work Scheduled (BCWS), giving the Project Manager insight into the health of their project. Add to this calculation the Actual Cost of Work Performed (ACWP), determining the Cost Variance (CV) between EV and AC (Actual Cost) will tell the Project Manager if the project is under, over, or right on budget compared to the expectation of the project plan. Using AI algorithms should help to lessen the amount of time it takes to compute these formulas manually. Integration of AI and EVM into existing algorithms and the effectiveness of these integrations would require access to the data for specific earned value project metrics, such as AC, PV, and Earned Value (EV), the standard KPI’s of EVM. Project performance metrics would need to be included, such as CV, Cost Performance Index (CPI), and Schedule Variance (SV). Project Prediction formula includes EAC (Estimate at Completion) cost (AC plus PCWR (Planned Cost of Work Remaining)). AI can perform these calculations quickly using AI algorithms. However, have they been used effectively to help projects to a successful conclusion?
By examining the results of past studies, this paper will determine the effectiveness of those results. Would a different way of applying the results allow for an increase in successfully concluded projects?
Limitations of the Study
A limitation of this study is its reliance on using previous studies rather than performing real-world studies with practitioners. Part of the reason for that limitation is that usage of AI with EVM in managing projects is just beginning, and as such, the application is low. Further limitation involves the time needed to complete this Master’s Thesis, so the number of algorithms analyzed will be purposely limited to those explicitly utilizing EVM.
Results
Project Predictor Tools
Artificial Neural Networks
Artificial Neural Networks (ANN) are computing systems that try to mimic biological neural networks, mostly mimicking animal brain function. These ANN systems learn to perform tasks by example, without being pre-programmed with task rules. An example of an ANN system is image recognition. Through supervised learning training databases, these ANNs learn to identify images that are labeled, so presented with an image of a cat, the system can go through its databases to identify the image presented correctly.
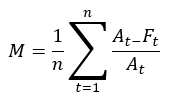
ANNs are mathematical models based on a collection of connected units known as artificial neurons with three different layers; input, hidden, and output layers, each composed of numerous neurons. These connections mimic the synapses in a bio-brain and can transmit signals to each neuron, each processing the information received and passing it along to other neurons. These signals are real numbers, and each neuron processes the sum of its inputs using a non-linear function. Weights are added as the neuron’s learn, which decrease or increase the signal strength. The signal travels through each of the layers, which perform different processes on a signal input. These signals travel through the input layer through to the output layer. Obtain signal control by setting thresholds causing the signal to be transmitted when the threshold is reached or crossed (Iranmanesh and Zarezadeh, 2008). ANNs can have more than three layers previously mentioned. Iranmanesh and Zarezadeh (2008) created ANN’s to forecast the actual cost (AC) to improve EVM containing five inputs and five outputs with one hidden layer. Their study was a comparison between real and forecasted data showing better performance based on the MAPE criterion. Mean Absolute Percentage Error (MAPE) is a statistical measure of prediction accuracy for forecasting methods and mainly used in trend estimations and loss functions for regression problems in machine learning. Iranmanesh and Zarezadeh (2008) study expressed it as a ratio using the following formula:
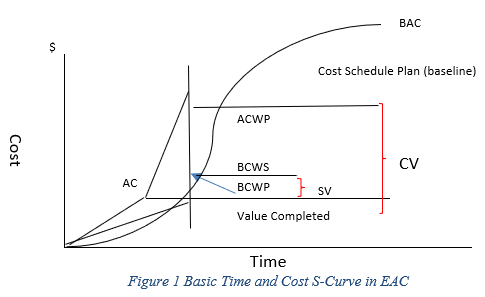
Iranmanesh and Zarezadeh (2008) study utilize 100 randomly simulated projects, each with 92 tasks with various precedence networks. ProGen (“project-generator/project_generator,” 2020) software created the simulated projects. They determined that a core piece of data needed would be ACWP. Along with the EAC, these pieces of data needed to be estimated accurately. Because EAC formulas are a combination of numerous data elements, including BCWS, BCWP, and ACWP, they can be shown as a time-cost S-curve, as displayed in figure 1 below (Iranmanesh and Zarezadeh, 2008):
Iranmanesh and Zarezadeh (2008) used ANNs because of their ability to approximate numerous functions; including non-linear functions, and the ability to “piecewise” approximations. Piecewise allows for the building of non-linear models. Defined Piecewise functions use multiple sub-functions applied to intervals of the primary function. Piecewise functions are used extensively in image identification applications. Neural network forecasting involves training and learning. Learning is a supervised function involving historical data with proper inputs and desired outputs given to the network. During the learning process, the network constructs input-output mappings adjusting weighting and biases during each pass through while optimizing each time to minimize error. Repeating this learning process minimizes error until meeting a satisfactory criterion. ANNs have the innate ability to learn and see the nuances present in EVM to predict the AC in a project accurately.
Iranmanesh and Zarezadeh (2008) study would use five different neural network types with different levels of neurons within the hidden layer. These neurons capture Neural Networks (NN) with optimal architecture with the error calculated MAPE criterion on the test data. NN is a model whose layered structures are like the networked structure of neurons in the brain, with layers of connected nodes. NNs can learn from data—so it can be trained to recognize patterns, classify data, and forecast future events. Table 1 below shows the results of the test data MAPE results (Iranmanesh and Zarezadeh, 2008):
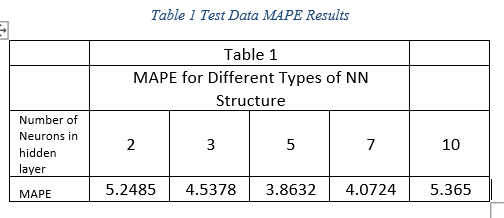
Upon comparing the errors, Iranmanesh and Zarezadeh (2008) chose the hidden layer with five neurons, since it had the least amount of errors, for training the NN. Further testing on two randomly selected projects produced the following forecasted ACWP and EAC results (Iranmanesh and Zarezadeh, 2008):
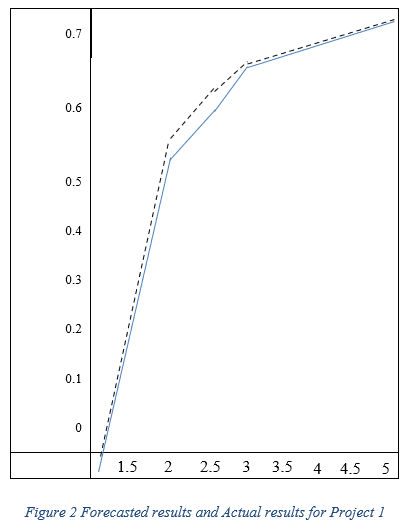
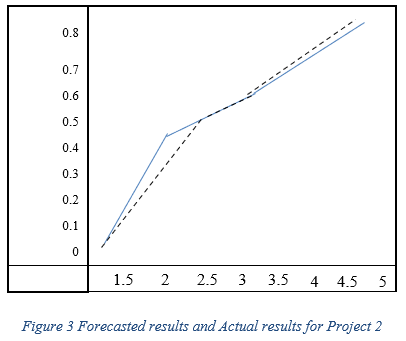
The continuous line in both Figs. 2 and 3 is the real ACWP value, and the dashed line is the forecasted value. As can be seen, the forecasting error is low. Table 2 below shows the absolute error for both projects (Iranmanesh and Zarezadeh, 2008):
Their results confirmed a strong relationship between forecasted and actual costs, as well as using ANNs in forecasting projects.
Decision Trees
Decision Trees commonly model decisions and their possible consequences generally identify paths to a goal and utilized in project management. They help project managers to take in to account all the possible variables, including time, cost, resource availability, to determine the best option for a decision (Wauters and Vanhoucke, 2016).
Bagging, also known as bootstrap aggregation, is used to reduce the variance in a decision tree algorithm. The idea is to create subsets of training data chosen randomly with replacement, using each subset to train the decision tree. Bagging is used in machine learning as an ensemble meta-algorithm to increase stability and accuracy in algorithms used in statistical classification and regression. Bagging also helps to prevent overfitting. Overfitting is a condition where a statistical model describes the random error in data instead of the relationship between the variables. Overfitting can be handled by removing layers or cutting the number of elements in the hidden layer, thereby reducing the network’s capacity. Two other methods of regulating overfitting are to apply regularization, such as adding cost to the loss function for larger weights or use dropout layers, which randomly remove certain features setting them to zero. While generally used in decision tree methods, bagging specializes in model averaging approach (Wauters and Vanhoucke, 2016).
The random forest, or random decision forest, is a classification algorithm consisting of numerous decision trees. It uses bagging and feature randomness when building each tree to try to create an uncorrelated forest of trees whose prediction by committee is more accurate than that of any individual tree. Feature randomness is node splitting in a random forest-based on a random subset of features in each tree. The random forest looks for patterns in a seeming forest of randomness.
Wauters and Vanhoucke (2016) employed random forest, k-means, and SVM methodologies to test dynamic scheduling and project control. K-Means clusters observations to its closest mean average, partitioning the results into Voronoi cells. Supervised SVM’s learning models use learning algorithms that analyze data used for classification and regression analysis. SVM’s use classification algorithms for two-group classification problems and work well with small amounts of data. Once SVM’s receive sets of labeled training data for multiple categories, they work well with the labeled data that can be linearly separated. When the data cannot be linearly separated, there are kernel functions that allow for linear separation; linear and nonlinear kernels help SVM to find the decision boundaries without changing the data.
Wauters and Vanhoucke (2016) studies involved generating data for different periods from which the algorithms could learn and then compare the results of the tests with EVM metrics. They divided their methodology into four blocks; data generation, data pre-processing, grid search, and testing.
Wauters and Vanhoucke (2016) generated data made up of two separate phases; first, the baseline data involved creating the project network, along with costs and durations. Early start calculations were used from the CPM to create the schedule. Each of the project networks was created fictitiously by controlling the Serial/Parallel (SP) indicator.
Progress data showed variation in the activity durations using Monte Carlo simulations. Monte Carlo techniques emulate activities in projects. These activities are carried out hundreds of times in order to show process variability and measure it. Events are determined using random numbers subjected to allocated probabilities. Allocated probabilities are created through a probability distribution to control the degree and probability of variability in activity durations. Wauters and Vanhoucke (2016) expressed this variability and distribution using the following formula:
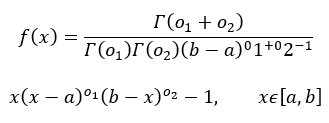
Where a and b equal the upper and lower random variable limit, Γ is the gamma function with two shape parameters, calculated using the following formula:
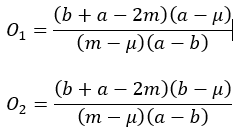
With the mean, the upper and lower random variable limits allow for a more extensive array of distributed shapes suited for project simulations desiring different outcomes. Using the Monte Carlo simulations allowed for the calculation of EVM measures, which gives the project manager an idea of the health of the project at any given moment. The attributes used as inputs for the AI methods used in Wauters and Vanhoucke (2016) study shown in Table 3 below:
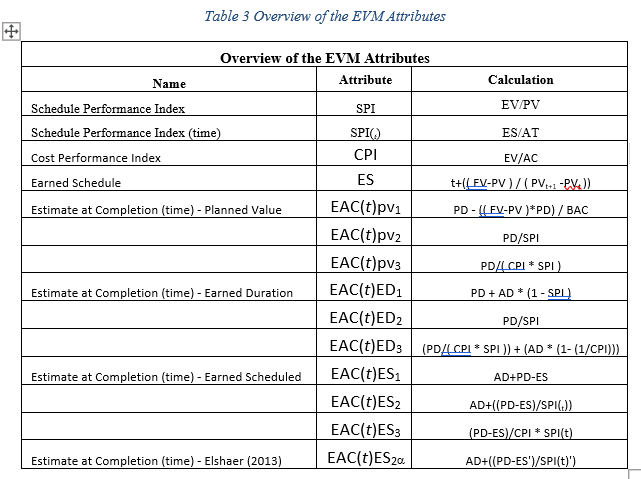
The SPI and CPI use the EVM metrics of PV, EV, and AC. Time forecasting uses EAC with PV and Earned Duration (ED) or ES used as subdivisions. Actual Duration (AD) and Planned Duration (PD) used in the EAC calculations. The BAC is based on the project baseline for total project cost if every task executed according to plan. Estimate at Completion (EAC) takes sensitivity calculations into account.
The creation of the data set in Wauters and Vanhoucke (2016) study consisted of a training set, a validation set, and a test set. The first phase divided the dataset into a percentage for training and the remainder for the test set. The training set would be divided further into a training set and a validation set. The validation set would fine-tune the algorithm, with the smaller training set used for learning. Boosting, which uses regression trees, is an optimization technique that minimizes loss by adding a new tree at each step and is applied during each pass-through of the training data set until reaching a level of satisfaction with the results.
Finally, Wauters and Vanhoucke (2016) study would use the MAPE as a statistical measure of prediction accuracy for forecasting methods. As previously stated above, MAPE assists with trend estimations and loss functions for regression problems in machine learning. Wauters and Vanhoucke (2016) expressed the MAPE as a ratio using the following formula:
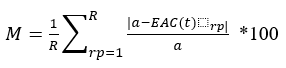
The computational phase of Wauters and Vanhoucke (2016) study comprised four sections, including data generation, attributes, data pre-processing and training, validation, and testing. Data generation consists of baseline data and the progress data. In both studies, Wauters and Vanhoucke (2016) and Wauters and Vanhoucke (2017) compared the performance of AI methods to EVM and Elshaer forecasting methods (Elshaer, 2013). For AI, the methods implemented were R (R Core Team, 2013) using the R template. The R template allows for the inputting of parameters for the training and validation phases. By using 5-fold cross-validation to select optimal parameters, these parameters applied to the test set. Table 4 below shows the best parameter settings for the AI techniques used in Wauters and Vanhoucke (2016) study and Table 5 shows the MAPE for different values of t; four levels of t; 50%, 90%, 95%, and 99%:
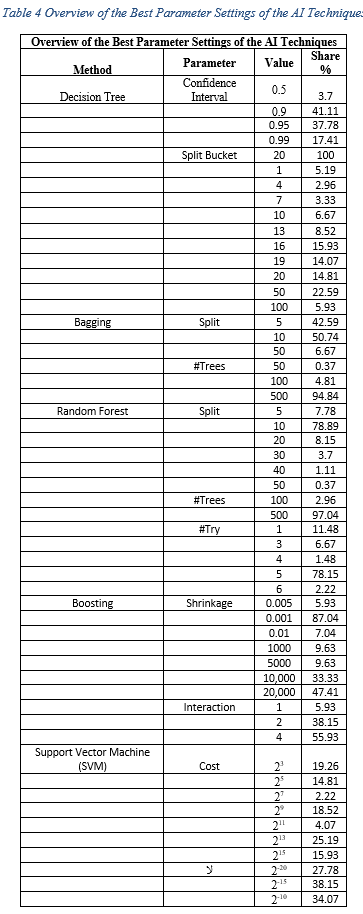
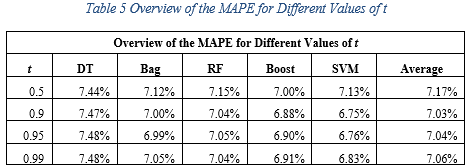
Table 5 shows that the best time for forecasting accuracy and computational expense is 0.9, with an average rate of 7.03%. Table 6 below shows the performance across the board of early, on-time, and late scenarios:
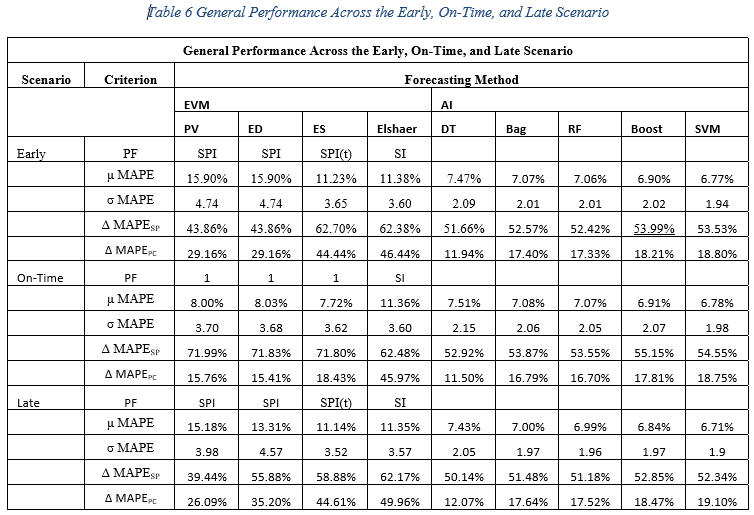
The steepest difference in performance is for on-time scenarios where forecasting for serial projects versus parallel projects are about 70% more accurate. AI methods show a 50% increase, but still less than that of the EVM and Elshaer methods. A given assumption is that as the project progresses and more is known, the more accurate duration can be forecasted, as shown in figure 4 below (Wauters and Vanhoucke, 2016), also shown in table 6 above:

As table 6 above shows improved forecasting as the project progresses, the results show lower improvement in the On-Time Scenario, were methods with a factor 1 performance yield the best results; this is with an assumption that the project progresses as planned. Wauters and Vanhoucke (2016) showed from this research that while AI methods improved as the project proceeded, compared to EVM and Elshaer methods, the improvement was less steep. The implication is that AI methods are better on average, but that improvement shrinks as more knowledge on project progress is known. They consider this finding to be significant since EVM/ES forecasting methods do not fare well in forecasting the early to mid-stages of the project. Their results imply that the AI methods are superior to forecasting than the EVM/ES methods. They showed that the mean and standard deviations for the AI methods are considerably lower than that of the earned value/earned schedule methods, especially in the early to mid-stages of the project when accurate forecasting is most needed.
Wauters and Vanhoucke (2017) study concentrated a k-Nearest Neighbor (k-NN) extension for forecasting with EVM. The k-NN method allowed for reducing the size of the training set and as a predicting method for predicting the real duration of a project. They found that the k-NN method increased forecasting stability. Stability for forecasting methods is determined stable if estimates or values do not deviate between successive tests. Stability in EVM shows a successful project if the CPI is stable. Significant variations in the EVM metrics are signs of a troubled project.
Wauters and Vanhoucke (2017) introduced the use of k-NN by as a predictor benchmarked against EVM and AI methods and to reduce the size of the training data set, so it has similar results. The AI methods form Wauters and Vanhoucke (2016) used smaller data sets, a process known as hybridizing. To identify the nearest neighbors at a given data point, k-NN uses historical data. While there are many k-NN variants, Wauters and Vanhoucke (2017) used a multidimensional binary search tree, also known as the k-d tree or k-dimensional tree. A k-d tree in computer science is a data structure used to organize number points with k dimensions using a binary search with constraints on it. It is beneficial for ranging nearest neighbor searches. Applications include credit risk, marketing, media audience forecasting, and loan payment predicting. The goal of using k-NN here is to determine the final duration of new observations and to be able to predict outcomes of the training instances closest to the new observations used. The following formula was used by Wauters and Vanhoucke (2017) to calculate the square root of the square difference’s attributes j in the training data set I and new observations:
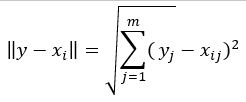
Furthermore, once identifying the k-NN instance, the instance y value predicted output calculates as follows:
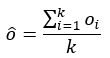
In order to prevent overfitting, and to tune the AI parameters, Wauters and Vanhoucke (2017) would repeatedly subdivide the training dataset and a separate validation set into smaller sets using cross-validation. Wauters and Vanhoucke (2016) used cross-validation successfully in a controlled environment. Once opportune parameters are found, the AI model is trained on the initial dataset and applied to the test set. Benchmarking against EVM model results occur once completing the training of the AI model.
Decision trees, with recursive partitioning, would repeatedly split the solutions into multiple regions maximizing specific measurements, entropy for example. A downside of a decision tree is their inherent instability, where a small change in the data leads to unexpected split points. The instability resolution came in using bagging and random forest techniques. Bagging selects splitting variables randomly from the predictors, and random forests restrict that selection to a smaller group of selectors. By boosting, they turn weak algorithms into stronger ones. SVM’s, with linear regression, map predictors into a higher plane using linear kernel functions to establish separability between training points.
Wauters and Vanhoucke (2017) would use the MAPE and Mean Lags to determine stability. The MAPEs formula used is like what Iranmanesh and Zarezadeh (2008) used in their study. Mean lag measures the lag structure in dynamic models and is used to estimate the average delay in linear regressive measurements and is determined using the following formula;
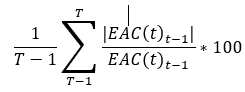
The results are shown below in Table 7
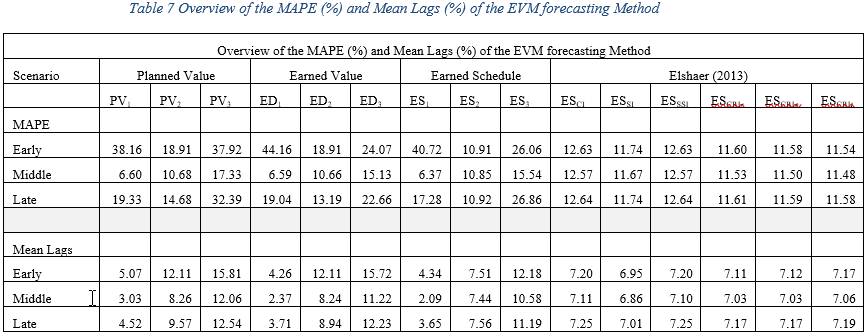
Wauters and Vanhoucke (2017) would observe that the AI methods and the nearest neighbor methods do not vary much in forecasting accuracy and stability, while the EVM methods differ significantly, especially within the MAPE measurements, as shown in table 7. Wauters and Vanhoucke (2017) were able to show that using the stability results from Wauters and Vanhoucke (2015) to the AI methods used in Wauters and Vanhoucke (2017), that the AI methods worked better than the EVM methods that Elshaer (2013) study showed, especially in the early and late scenarios.
Wauters and Vanhoucke (2017) were able to show in this study, and previous studies; Wauters and Vanhoucke, 2014; Wauters and Vanhoucke (2015); and Wauters and Vanhoucke, (2016) that while the AI methods were effective in specific scenarios, the EVM methods were more effective in high-risk scenarios. AI performs better in the early and late stages of projects, even better when the project is well along in execution where it provides ample information.
Discussion and Conclusion
This study began asking two questions; can artificial Intelligence, when integrated with EVM tools, assist Project Managers in increasing project completion success rates above 95%? It appears that AI has a way to go to help improve the successful completion rate of projects. However, it has made a good start, and with further research, we will see many assistive tools in the next 5-10 years that will make Project Managers’ life much more comfortable. Furthermore, keep in mind, computers are good at delivering the same jobs over and over as per programming, nothing more; They can learn, per programming; however, computers are not self-aware.
Many of the studies, as cited in the literature review, concentrated on using AI to predict project success than having focused on any practical use of AI tools in assisting Project Managers in managing projects. Thus, most studies have limited themselves to determining if AI can be used to predict project success. All the studies cited in the literature review and the results have shown limited success in using AI to predict project outcomes (Iranmanesh and Zarezadeh, 2008; Wauters and Vanhoucke, 2014; Wauters and Vanhoucke, 2015; Wauters and Vanhoucke, 2016; Wauters and Vanhoucke, 2017). Moreover, while the AI methods were effective in specific scenarios, the EVM methods were more effective in high-risk scenarios. AI performs better in the early and late stages of projects, even better when the project is well along in execution where it provides ample information.
Earned Value Project Management (EVPM), as described by Kerzner (2015), is a systematic process that uses earned value as the primary tool for integrating cost, schedule, technical performance management, and risk management. EVPM can determine the actual status of a project at any given point in the project, but only when following organizational rules, requiring a disciplined approach.
There are many reasons why every project should use EVPM. Fleming and Koppelman (2010) describe how EVPM provides a single management system that all projects should employ. The relationship of the work scheduled to work completed, to managing the costs and the schedule, provides an actual gauge of whether one is meeting the goals of the project. The most critical association is of work completed to how much money spent to accomplish the work provides an accurate picture of the actual performance cost.
EVM integrates the project scope, schedule, and costs into an organized process used in project forecasting (Fleming & Koppelman, 2010). However, EVM also provides an accurate measurement of the project’s work as performed against its baseline. It provides the project manager with detailed information on the status of the project; is it behind schedule, ahead of schedule, on time, over or under budget. Information provided by EVM is practical information project managers can use to determine project direction.
Practical AI Tools in Project Management
AI-assisted Project Management
AI-assisted Project management is an enabled system that can handle day-to-day project management operations without subsequent human intervention; only the initial setup required; after that, the enabled system runs on its own. The power of AI will be able to automate many tasks in project management. Examples include determining project requirements. It could outline project tasks. It could determine task precedence and scheduling. AI could determine qualified resource availability, cost and budgeting, status reports, risk estimations, and possible recourse for resolving problems. AI provides early, accurate forecasting of project success (Wauters and Vanhoucke, 2017).
Project Implementation Decisions
Selecting the most viable projects is a matter of determining project success and financial viability. Which project has a higher chance of success, which project fits within the organization’s overall plan, which project shows the highest return on investment (ROI), are questions Program Managers ask and answer when determining which projects get the green light to move forward. It is all about prioritization. An AI selection tool would need to include success forecasting AI algorithms, such as those suggested by Wauters and Vanhoucke (2016). As noted above, studies have shown these tools to have limited success rates. Each of those studies used EVM methods only to compare EVM to AI methods, not to use the EVM methods integrated directly into an AI algorithm.
Chatbots
Chatbots are programs that mimic human conversations; they would not pass the Turing test. The Turing test was developed by Alan Turing (Turing, 1950) as a definition for testing a machine’s ability to think like a human; to exhibit human intelligence such that one could not tell the difference between humans and machines. Chatbot’s common usage is to answer questions from users that lead to providing services and answering a preset list of questions. Chatbots typically used in dialog systems like information acquisition or customer service applications. Chatbots use Natural Language Processing (NLP) algorithms to capture keywords in the voice input to pull together a response from a list of likely output. As stated earlier, NLP can decipher utterances using language subset and nuances special to project management. Tests have shown abilities to reveal information based on these utterances in emails, status reports, meeting recordings showing that a resource or a stakeholder believes the project to be on course or in jeopardy of falling behind (Munir, 2019). Chatbots, as virtual assistants, include usage in conversational commerce, eCommerce, education, finance, health, and news. Chatbots usage includes messaging applications, speech assistants, to create automated communication and personalized customer experiences. Chatbots can be used to schedule meetings. Simply ask the scheduling bot to arrange an hour-long meeting on a given topic, and it can access all the participant’s calendars, including available conference rooms, quickly finding the optimal time to meet. If someone decides to opt-out of the meeting, the bot can quickly reschedule the meeting for another time. As Turing described, a Chatbot, while not exhibiting total human intelligence, is such a machine that one would have difficulty telling the Chatbot apart from the human.
A constant problem many Project Managers must face daily is getting project team members to provide various pieces of status information concerning their portion of the project. Chatbots can remind team members that a report is due, RFI’s are due, estimates for work are due, to enter time spent on tasks. All this information is vital to running an active project. Chatbots can provide an interface to allow project members to submit the needed information quickly. The chatbot would be able to use this information to produce daily, weekly, monthly status reports on the project; the chatbot would be able to identify any issues and roadblocks notifying the Project Manager of the specific issues as well as possible solutions.
Chatbots are particularly adept at forecasting risk in the project. By examining the project schedule, a chatbot could determine if a task’s status is on schedule, or it could be the cause of a possible delay in the project timeline. A Chatbot’s ability to decipher incoming status reports would allow it to determine the percentage of work completed. Examining the value of completed work and impact on the critical path, Chatbots determine if the project timeline is being met or is behind schedule. The Chatbot would make all necessary adjustments to the schedule to determine if an issue exists, adjust the scheduling of required resources, and determine the overall impact on the project. The Chatbot could mine data to analyze the team behavior to determine if tasks completed are per project schedule or if there will be problems. Many industries today, including finance, banking, counterterrorism, have found AI Chatbots useful as predictive tools.
AI can be an add-on to many project functions. No project management software has full AI capabilities. As discussed above, many of the AI tools available are expanding capabilities, but not offering full AI capabilities (Theobald, 2018). Chatbots, or Virtual Assistants (VA), for example, can execute tasks by merely speaking a few lines of instructions or requests (Theobald, 2018). Chatbots are used extensively in the customer service industries, such as banking. A PM would simply request the project Chatbot to deliver a report on the status of the project. The VA would pull together all the information required from a variety of sources. The VA could be programmed to do the same work a PM today does in order to produce the status report. The PM would look at the project schedule to determine expected work completed by the date the status report is due. The PM would determine the work, the resource doing the work, the time required to complete the work, the status of the work as of the last status report. The PM reaches out to each of the identified resources via email or in-person to request their status report. Each of the resources will submit their status reports either in-person or via email. The PM begins collating the information into a comprehensive status report and then sends it to all the stakeholders listed in the communications plan. A VA could easily handle these tasks automatically, and within a matter of hours, all by the PM merely saying, Hey Siri. Nevertheless, the capability of voicing a command to a project software is still in the future (Boudreau, 2019).
Risk Management
As discussed early in the results, evaluating project risks brings the need for changing project objectives during a project. It is these risk analysis tools that allow the PM to transform an impossible project into a successful project (Campbell, 2012). Using AI to evaluate project risks becomes increasingly more accessible in determining the impact on the project timeline (Boudreau, 2019). Shishodia, Dixit, and Verma (2018) found that schedule, resource, and scope risks are the most prominent risk categories in projects. AI could assist in determining the impact on each of these aspects of the project.
Similarly, AI could extract insights drawn from the detailed cross-sector analysis, depicting different risk categories based on NTCP project characteristics (Shishodia et al., 2018). Managing risks requires accurate communications and being ready with a plan. The PM cannot be risk-averse and must accept risk will happen; it is part of the job; doing nothing is not an option (Gido and Clements, 2012). Identifying risks, analyzing the potential impact on the project, and the likelihood of occurrence requires developing risk response plans, and monitoring those risks, AI could be invaluable (Kendrick, 2009).
Earned Value Management
Integration management and EVM work together to ensure the processes and activities that identify, describe, join, and synchronize the various processes and activities within the process groups stay on course (Institute, 2019). EVM tools allow Project Managers to measure project performance to confirm it is on course. Scope, the Work Breakdown Structure (WBS), the project schedule, and regular reporting, are all the tools when managing a project. However, EVM is best when using all the tools available.
As valuable as EVM methods are with analyzing the current status of a project in AC, PV, PS, and risks, the test results presented in previous research show only limited utilization in forecasting project schedule completion when using AI methods. While EVM utilization is extensive in forecasting project completion, much of the remainder of EVM methods neglect using EV, AC, ACWP, and PV integration with AI applications. Determining why a project is behind, ahead, or even on schedule automatically would be a great benefit to project management (Boudreau, 2019). Investigating how the AI algorithms determine project forecasting would help in pointing out that a project is behind schedule will need further study; what is needed is how these algorithms could provide an answer putting the project back on track per plan. Further study will be needed to project what it would cost or even what resources or plan of action would be required to put the project back on track.
Numerous AI tools help manage projects. These include project success predictor tools, stakeholder management tools such as NLP, virtual assistants such as Chatbots, which can assist in managing change control and risk management, and analyzing resources needs and assignments. While there are tools that help with the WBS and scheduling verification, these tools are not currently known to have the ability to learn from the data, so are not exact AI tools.
As pointed out by AI Lahmann et al. (2018), AI can help integrate the administration of projects without requiring input. AI’s ability to perceive the environment allows for taking action increases the likelihood of a successful outcome. Furthermore, AI could manage multiple projects. AI programming would allow for making decisions automatically. It can help with identifying the right personnel, skills, and experience needed to finish the defined task. AI can aid Project Managers in making informed decisions (Munir, 2019).
Project predictor tools could help to determine if a project has a high probability of success (Boudreau, 2019). Savings in resources and energy could be vast by evaluating projects for success before starting the project. However, the tool requires a high-reliability rating (Boudreau, 2019), thus needing further analysis and research. Wauters and Vanhoucke (2015) have shown the accuracy of these AI algorithms in their research, primarily when used against EVM/ES methods where the datasets are similar, especially in the early phases of the project or when the project nears completion. The problem they met occurs when increasing the differences in datasets showing AI prediction limitations.
The PM could use NLP to assist in stakeholder management and sentiment analysis. Communication and managing people using AI may be able to offer commonly known suggestions for handling an upset resource. However, it would take human intervention to resolve the issues of an upset team member (Boudreau, 2019).
Change requests made to consider a change in the scope of a project requiring impact analysis on the scope, the schedule, and the budget can be a massive task. Project Managers determine if the change fits the existing scope or changes it overall. Does the change require extra resources, or can the current team members manage? What will the cost impact be? Will the requested change impact other projects currently in the queue? AI could provide answers to manage change requests collecting all the data, analyzing, and produce a calculation of the overall impact on the project (Boudreau, 2019).
Auth, Jokisch, and Dürk (2019) described Automated Project Management (APM) as software applications supporting scheduling, budgeting, resources, reporting, risk analysis, change control. APMs tied closer to AI to include data-driven project management, predictive project analytics, and project management bots could help to drive up success rates for projects; further research could be beneficial.
AI focusses on the development of intelligent agents that distinguish their environment, allowing them to take actions based on that environment (Russel and Norvig, 2016). These systems can act freely, continue for prolonged periods, adjust to changes, and track objectives. They strive for the best results under uncertain conditions, much like a project’s environment (Auth et al., 2019). AI uses scientific, mathematical models and methods with statistics/stochastics, computer science, psychology, cognition, and neuroscience methodologies, producing results based on facts, not emotion.
AI is in the early stages of development and is moving quickly. AI very well may create an estimated 2.3 million jobs, and it could create over $2.9 trillion in business value (Kashyap, 2019). Current tools have made project management more robust, but they do not meet the Turing test. It still takes a human to decide.
The question this study aimed to answer was whether AI, when integrated with EVM, would improve project completion success rate to over 95% remains to be determined. Previous studies have not utilized integrating EVM fully with AI, concentrating only on forecasting project successful completion. Being able to determine with any certainty that a project is on-time, within budget at a given point has not been determined and needs further research.
Summary
This study has shown that there are possibilities for the practical application of AI integrated with ECM method metrics. The study shows that there has been valuable research in determining the successful outcome of projects, even early in the project process. However, more work is needed to develop practical applications that can assist Project Managers in completing projects successfully.
Recommendations
Further research in integrating EVM metrics with AI algorithms, especially in practical usage, to assist project management, needs to be continued. While analyzing project success is useful, increasing research in the practical application, less in the theoretical application, will likely see an increase in project success rates.
List of References:
Archibald, R. D., & Villoria, R. L. (1966). Network-based management systems (PERT/CPM). New York: Wiley.
Auth, G., Jokisch, O., & Dürk, C. (2019). Revisiting automated project management in the digital age – a survey of AI approaches. Online Journal of Applied Knowledge Management, 7(1), 27-39. https://doi.org/10.36965/ojakm.2019.7(1)27-39
Bayern, M. (2019, September 18). How project managers are essential to AI deployment. Retrieved January 3, 2020, from https://www.techrepublic.com/article/how-project-managers-are-essential-to-ai-deployment/
Bessen, J. (n.d.). HOW COMPUTER AUTOMATION AFFECTS OCCUPATIONS: TECHNOLOGY, JOBS, AND SKILLS. Retrieved from http://www.bu.edu/law/files/2015/11/NewTech-2.pdf
Bhavsar, K., Shah, V., & Gopalan, S. (2019). Business Process Reengineering: A Scope of Automation in Software Project Management using Artificial Intelligence. International Journal of Engineering and Advanced Technology, 9(2), 3589-3594. https://doi.org/10.35940/ijeat.b2640.129219
Boudreau, P. (2019). Applying artificial intelligence to project management. Toronto, Canada: Independently Published
Campbell, P. M. (2012). Communications skills for project managers. New York, NY: Amacom American Managemen.
Dam, H. K., Tran, T., Grundy, J., Ghose, A., & Kamei, Y. (2019). Towards Effective AI-
Powered Agile Project Management. 2019 IEEE/ACM 41st International Conference on Software Engineering: New Ideas and Emerging Results (ICSE-NIER). https://doi.org/10.1109/icse-nier.2019.00019
Davenport, T. H., & Kirby, J. (2016). Only Humans Need Apply: Winners and Losers in the Age of Smart Machines. New York, NY: HarperCollins.
Davenport, T. H. (2018). The AI Advantage: How to Put the Artificial Intelligence Revolution to Work. MIT Press.
Davenport, T. H., & Ronanki, R. (2018). Artificial Intelligence for the Real World. Harvard Business Review, (2018), 108-116. https://hbr.org/2018/01/artificial-intelligence-for-the-real-world
Elshaer, R. (2013). Impact of sensitivity information on the prediction of project’s duration using earned schedule method. International Journal of Project Management, 31(4), 579-588. https://doi.org/10.1016/j.ijproman.2012.10.006
Fleming, Q. W., & Koppelman, J. M. (2010). Earned value project management. Newtown Square, PA: Project Management Institute.
Florentine, S. (2017, February 27). IT project success rates finally improving. Retrieved January 18, 2020, from https://www.cio.com/article/3174516/it-project-success-rates-finally-improving.html
Highsmith, J. A. (2010). Agile Project Management: Creating Innovative Products. Addison-Wesley Professional.
Gido, J., & Clements, J. P. (2017). Successful project management. Australia [etc.: South-Western Cengage Learning.
Hofmann, P., Johnk, J., Protschky, D., & Urbach, N. (2020, February). Developing Purposeful AI Use Cases – A Structured Method and Its Application in Project Management [Paper presentation]. 15th International Conference on Wirtschaftsinformatik (WI), Potsdam, Germany. https://www.wi.uni-bayreuth.de/pool/Dokumente/Developing-Purposeful-AI-Use-Cases-_-A-Structured-Method-and-Its-Application-in-Project-Management.pdf
Hosley, W. N. (1987, August). The application of artificial intelligence software to PM. https://www.pmi.org/learning/library/application-artificial-intelligence-software-pm-5234
IEEE Computer Society Predicts the Future of Tech: Top 10 Technology Trends for 2019 • IEEE Computer Society. (n.d.). Retrieved from https://www.computer.org/web/pressroom/ieee-cs-top-technology-trends-2019
Ihekweaba, O., Ihekweaba, C., & Inyiama, H. C. (2013). Intelligent Agent-based Framework for
Project Integration Management [Paper presentation]. Proceedings on the International
Conference on Artificial Intelligence (ICAI), Las Vegas, NV. https://search-proquest-com.ezproxy1.apus.edu/docview/1629346555?accountid=8289
Institute, P. M. (2019). A Guide to the Project Management Body of Knowledge (PMBOK(R) Guide-Sixth Edition / Agile Practice Guide Bundle (HINDI) (6th ed.). Project Management Institute.
Iranmanesh, S. H., & Zarezadeh, M. (2008). Application of Artificial Neural Network to Forecast Actual Cost of a Project to Improve Earned Value Management System. International Journal of Social, Behavioral, Educational, Economic, Business and Industrial Engineering, 2(6).
Jordan, A. (2018). Automated project management? Retrieved from https://www.projectmanagement.com/articles/449492/Automated-Project-Management-
Joshi, C. S., & Dangwal, P. G. (2012). Management of business process reengineering projects: a case study. Journal of Project, Program & Portfolio Management, 3(1), 78. https://doi.org/10.5130/pppm.v3i1.2783
Kashyap, V. (2019, September 12). 4 ways AI will change project management: trends in 2019 and the future Ai. Retrieved January 19, 2020, from https://bigdata-madesimple.com/ai-project-management-2019-trends/
Kendrick, T. (2009). Identifying and managing project risk: Essential tools for failure-proofing your project. New York: AMACON.
Kendrick, T. (2012). Results without authority: Controlling a project when the team doesn’t report to you (2nd ed.). New York, NY: AMACOM.
Kerzner, H. (2014). Project recovery: Case studies and techniques for overcoming project failure. Hoboken, NJ: John Wiley & Sons, Inc
Kerzner, H. (2015). Project management 2.0: Leveraging tools, distributed collaboration, and metrics for project success. Hoboken, NJ: John Wiley & Sons.
Kerzner, H. (2017). Project Management: A Systems Approach to Planning, Scheduling, and Controlling [Kindle 12] (12th ed.).
Kerzner, H. (2018). Project Management Best Practices: Achieving Global Excellence (4th ed.). John Wiley & Sons
Ko, C., & Cheng, M. (2007). Dynamic Prediction of Project Success Using Artificial Intelligence. Journal of Construction Engineering and Management, 133(4), 316-324. https://doi.org/10.1061/(asce)0733-9364(2007)133:4(316)
Lahmann, M., Keiser, P., & Stierli, A. (2018, September 7). AI will transform project management. Are you ready? Retrieved from https://www.pwc.ch/en/insights/risk/transformation-assurance-ai-will-transform-project-management-are-you-ready.html
Lee, K. (2018). AI Superpowers: China, Silicon Valley, and the New World Order. Boston, MA: Houghton Mifflin Harcourt.
Lipke, W. H. (2009). Earned schedule: An extension to earned value management– for managing schedule performance. Raleigh, N.C.: Lulu Pub
Microsoft 365 Business. (n.d.). Microsoft – Official Home Page. Retrieved February 25, 2020, from https://www.microsoft.com/en-us/microsoft-365/business
Microsoft Project Software. (n.d.). Retrieved from https://products.office.com/en-us/project/project-management-software
Mullaly, M. (2011, March 1). ProjectManagement.com – A Critical Look at Project Initiation. Retrieved from http://www.projectmanagement.com/articles/262617/A-Critical-Look-at-Project-Initiation
Munir, M. (2019). How Artificial Intelligence Can Help Project Managers. Global Journal of Management and Business Research, 19(4).
Project Management Institute. (2017, February). PMI Pulse of the Profession® 2017. Retrieved from https://www.pmi.org/learning/thought-leadership/pulse/pulse-of-the-profession-2017 project-generator/project_generator. (2020, January 5). GitHub. Retrieved March 14, 2020, from https://github.com/project-generator/project_generator
Robertson, S., & Robertson, J. (2013). Mastering the requirements process: Getting requirements right. Upper Saddle River, NJ: Addison-Wesley.
Russell, S., & Norvig, P. (2016). Artificial Intelligence: A Modern Approach. Createspace Independent Publishing Platform.
Shishodia, A., Dixit, V., & Verma, P. (2018). Project risk analysis based on project characteristics. Benchmarking: An International Journal, 25(3), 893-918. https://doi.org/10.1108/bij-06-2017-0151
Subramanian, V., & Ramachandran, R. (2010). McGraw-Hill’s PMP certification mathematics: project management professional exam preparation. New York, NY: McGraw-Hill.
Theobald, O. (2018). Machine Learning for Absolute Beginners: A Plain English Introduction (2nd ed.). Independently Published.
Tichy, N. M., & Cohen, E. B. (2009). The leadership engine: How winning companies build leaders at every level. New York, NY: Harper Business.
TURING, A. M. (1950). I.—COMPUTING MACHINERY AND INTELLIGENCE. Mind, LIX(236), 433-460. https://doi.org/10.1093/mind/lix.236.433
Verzuh, E. (2015). The fast forward MBA in project management, fourth edition. Hoboken, NJ: John Wiley & Sons.
Wauters, M., & VanHoucke, M. (2014). Support vector machine regression for project control forecasting. Automation in Construction, 47, 92-106. https://doi.org/10.1016/j.autcon.2014.07.014
Wauters, M., & Vanhoucke, M. (2015). Study of the Stability of Earned Value Management Forecasting. Journal of Construction Engineering and Management, 141(4), 04014086. https://doi.org/10.1061/(asce)co.1943-7862.0000947
Wauters, M., & Vanhoucke, M. (2016). A comparative study of Artificial Intelligence methods for project duration forecasting. Expert Systems with Applications, 46, 249-261. https://doi.org/10.1016/j.eswa.2015.10.008
Wauters, M., & Vanhoucke, M. (2017). A Nearest Neighbour extension to project duration forecasting with Artificial Intelligence. European Journal of Operational Research, 259(3), 1097-1111. https://doi.org/10.1016/j.ejor.2016.11.018
Zujus, A. (2018, September 12). AI Project Development? How Project Managers Should Prepare. Retrieved January 3, 2020, from https://www.toptal.com/project-managers/technical/ai-in-project-management